
In today’s rapidly changing and fiercely competitive business landscape, it is essential for investors and industry enthusiasts to thoroughly analyze companies. In this article, we will conduct a comprehensive industry comparison, evaluating Amazon.com (NASDAQ:AMZN) against its key competitors in the Broadline Retail industry. By examining key financial metrics, market position, and growth prospects, we aim to provide valuable insights for investors and shed light on company’s performance within the industry.
Amazon.com Background
Amazon is the leading online retailer and marketplace for third party sellers. Retail related revenue represents approximately 74% of total, followed by Amazon Web Services (17%), and advertising services (9%). International segments constitute 22% of Amazon’s total revenue, led by Germany, the United Kingdom, and Japan.
| Company | P/E | P/B | P/S | ROE | EBITDA (in billions) | Gross Profit (in billions) | Revenue Growth |
|---|---|---|---|---|---|---|---|
| Amazon.com Inc | 31.96 | 6.54 | 3.54 | 6.02% | $45.5 | $91.5 | 13.4% |
| Alibaba Group Holding Ltd | 18.52 | 2.69 | 2.74 | 4.26% | $53.52 | $111.22 | 1.82% |
| PDD Holdings Inc | 11.70 | 2.93 | 2.86 | 8.89% | $25.79 | $58.13 | 7.14% |
| MercadoLibre Inc | 49.03 | 16.38 | 3.89 | 7.06% | $0.88 | $3.21 | 39.48% |
| Sea Ltd | 59.55 | 7.92 | 4.09 | 3.77% | $0.48 | $2.6 | 38.3% |
| Coupang Inc | 131 | 10.60 | 1.53 | 2.02% | $0.32 | $2.72 | 17.81% |
| JD.com Inc | 9.72 | 1.26 | 0.24 | 2.3% | $7.36 | $50.47 | 14.85% |
| eBay Inc | 17.94 | 7.75 | 3.58 | 13.35% | $0.74 | $2.0 | 9.47% |
| Vipshop Holdings Ltd | 10.12 | 1.64 | 0.66 | 3.74% | $1.91 | $6.05 | -3.98% |
| Dillard’s Inc | 16.70 | 4.69 | 1.46 | 6.55% | $0.14 | $0.58 | -2.93% |
| Ollie’s Bargain Outlet Holdings Inc | 35.03 | 4.15 | 3.06 | 3.49% | $0.09 | $0.27 | 17.49% |
| Global E Online Ltd | 962.25 | 7 | 7.54 | 1.17% | $0.02 | $0.1 | 27.9% |
| MINISO Group Holding Ltd | 19.66 | 3.87 | 2.12 | 4.56% | $0.73 | $2.2 | 23.07% |
| Macy’s Inc | 11.38 | 1.21 | 0.25 | 1.95% | $0.36 | $2.1 | -1.9% |
| Kohl’s Corp | 8.46 | 0.45 | 0.11 | 3.97% | $0.45 | $1.53 | -4.98% |
| Hour Loop Inc | 63.33 | 8.71 | 0.47 | 7.15% | $0.0 | $0.02 | 7.56% |
| Average | 94.96 | 5.42 | 2.31 | 4.95% | $6.19 | $16.21 | 12.74% |
table {
width: 100%;
border-collapse: collapse;
font-family: Arial, sans-serif;
font-size: 14px;
}
th, td {
padding: 8px;
text-align: left;
}
th {
background-color: #293a5a;
color: #fff;
text-align: left;
}
tr:nth-child(even) {
background-color: #f2f4f8;
}
tr:hover {
background-color: #e1e4ea;
}
td:nth-child(3), td:nth-child(5) {
text-align: left;
}
.dividend-amount {
font-weight: bold;
color: #0d6efd;
}
.dividend-frequency {
font-size: 12px;
color: #6c757d;
}
Through a detailed examination of Amazon.com, we can deduce the following trends:
-
The stock’s Price to Earnings ratio of 31.96 is lower than the industry average by 0.34x, suggesting potential value in the eyes of market participants.
-
It could be trading at a premium in relation to its book value, as indicated by its Price to Book ratio of 6.54 which exceeds the industry average by 1.21x.
-
The stock’s relatively high Price to Sales ratio of 3.54, surpassing the industry average by 1.53x, may indicate an aspect of overvaluation in terms of sales performance.
-
The Return on Equity (ROE) of 6.02% is 1.07% above the industry average, highlighting efficient use of equity to generate profits.
-
With higher Earnings Before Interest, Taxes, Depreciation, and Amortization (EBITDA) of $45.5 Billion, which is 7.35x above the industry average, the company demonstrates stronger profitability and robust cash flow generation.
-
The gross profit of $91.5 Billion is 5.64x above that of its industry, highlighting stronger profitability and higher earnings from its core operations.
-
The company is experiencing remarkable revenue growth, with a rate of 13.4%, outperforming the industry average of 12.74%.
Debt To Equity Ratio
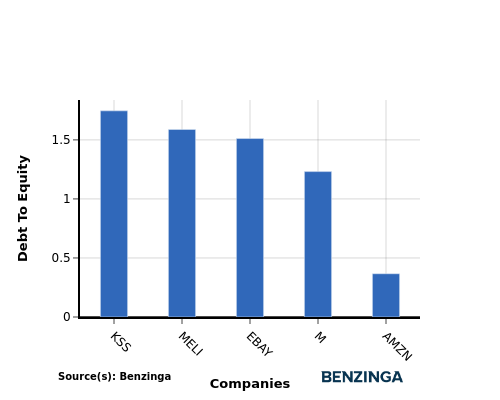
The debt-to-equity (D/E) ratio is a key indicator of a company’s financial health and its reliance on debt financing.
Considering the debt-to-equity ratio in industry comparisons allows for a concise evaluation of a company’s financial health and risk profile, aiding in informed decision-making.
When evaluating Amazon.com alongside its top 4 peers in terms of the Debt-to-Equity ratio, the following insights arise:
-
When considering the debt-to-equity ratio, Amazon.com exhibits a stronger financial position compared to its top 4 peers.
-
This indicates that the company has a favorable balance between debt and equity, with a lower debt-to-equity ratio of 0.37, which can be perceived as a positive aspect by investors.
Key Takeaways
For Amazon.com, the PE ratio is low compared to its peers in the Broadline Retail industry, indicating potential undervaluation. The high PB and PS ratios suggest that the market values Amazon.com’s assets and sales highly. Amazon.com’s high ROE, EBITDA, gross profit, and revenue growth outperform its industry peers, reflecting strong financial performance and growth potential.
This article was generated by Benzinga’s automated content engine and reviewed by an editor.